How to Prevent Performance Bottlenecks Before They Happen

Performance bottlenecks are a constant in any high-load system. And the bigger the system, the more places they tend to hide.
While many teams wait until issues surface in production, we all know that performance degradation rarely happens overnight. It accumulates gradually, spreading across familiar areas like database access, caching layers, job queues, and third-party APIs.
At Expert Soft, we have learned in practice that the most effective way to manage performance bottlenecks is to address them before minor inefficiencies snowball into wide problems. That’s why we design with a proactive mindset, building in early detection mechanisms that help clients stay ahead of instability and avoid costly last-minute firefighting.
In this article, we’ll walk through the common failure zones we’ve observed in enterprise ecommerce platforms, show what early warning signs to look for, and outline a preventive framework based on lessons from high-scale client projects.
Quick Tips for Busy People
Here’s a short summary of the key ideas you should remember:
- Know where bottlenecks are likely to occur: data access, caching, integrations, and background jobs are common problem areas in high-load ecommerce systems.
- Don’t wait for symptoms: latency drift, slow cron jobs, and queue growth signal problems, so address them before they affect users.
- Build prevention into architecture: embedding observability and performance awareness early avoids expensive fixes and delivery delays later.
- Catch issues before they reach production: benchmark key flows, automate load testing, and monitor real-user experience in every release cycle.
- Refactor before scaling breaks things: data structures that worked at launch may not hold under growth—review and adjust continuously.
- Remember that integrations are prone to failure: design imports and APIs with retries, timeouts, and fallback logic to prevent system-wide issues.
- Use metrics that show the user’s perspective: Core Web Vitals and RUM reveal front-end problems that back-end metrics alone cannot show.
- Performance is key: a preventive approach protects uptime, keeps teams focused, and makes sure the system helps the business grow.
Let’s take a closer look at where performance bottlenecks typically emerge and how to address them before they escalate.
The Cost of Late Issues Discovery
In high-load environments, performance flaws that reach production rarely stay isolated. They often appear at critical times, like campaign launches, busy events, or peak sales periods. This is when disruptions can be the most costly. By the time the symptoms show up, the effects are already impacting business metrics:
-
1
Revenue loss
from slow pages, failed campaigns, and abandoned carts.
-
2
Customer trust erosion
when users experience delays or inconsistent site behavior.
-
3
Escalating operational costs
as engineers are pulled into urgent production fixes.
-
4
Release delays
since performance-related changes often require full module retesting.
When performance monitoring is reactive instead of built into the development process, it becomes harder to find bottlenecks. Fixing these issues costs more and can delay delivery pipelines. Even small inefficiencies, if overlooked, can grow into major blockers that impact system stability and decision-making.
Long story short, teams that avoid performance surprises build strong habits early. They keep a close eye on the areas most prone to slowdowns, tracking the patterns that typically signal trouble.
Common Bottlenecks That Degrade Performance
While system architectures vary, the main causes of performance issues often show up in the same areas. By monitoring these patterns early, you allow your team to step in before small problems escalate into larger system issues. Here are the most common performance hotspots in high-load ecommerce platforms and why these areas tend to cause problems as systems expand.
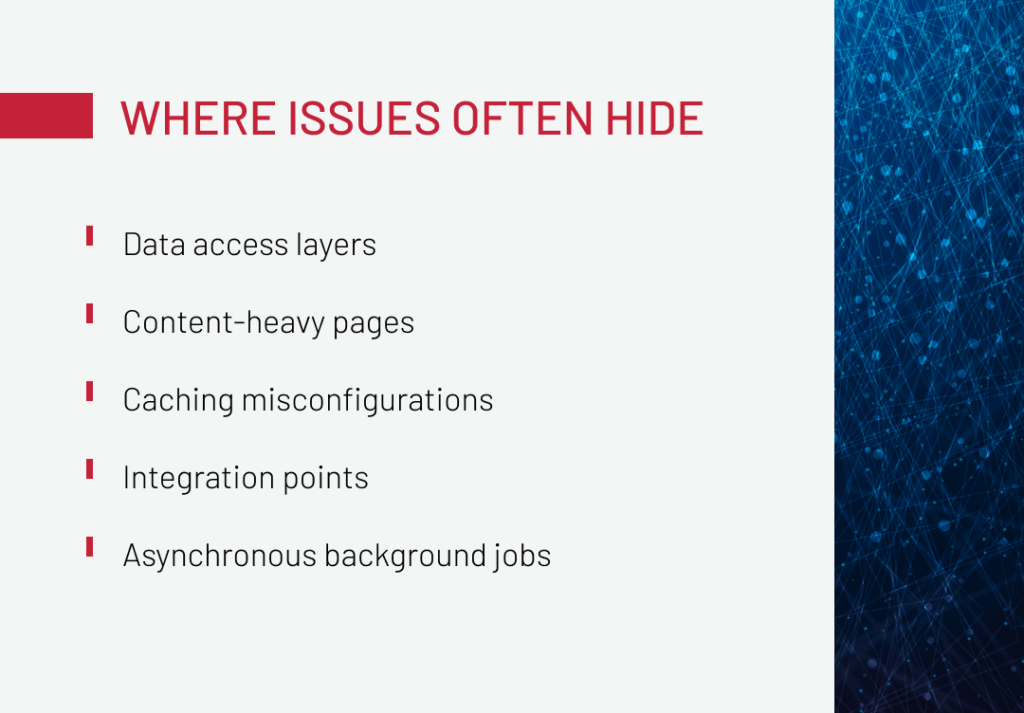
Data access layers
This is often one of the first areas to show stress as the system scales.
Weak points usually include poorly optimized queries, missing indexes, or inefficient joins that quietly accumulate load.
For example, in one of our projects, excessive use of localized attributes resulted in a 100x spike in database queries. Here, the solution was to restructure the schema and limit localization to relevant fields, which helped reduce query volume and stabilize memory usage.
-

Typical symptoms that signal inefficiencies:
sluggish product search, database timeouts, and increasing memory pressure on database nodes.
Content-heavy pages
Media-rich products and landing pages are common culprits when performance lags. Large images, embedded videos, and interactive blocks often overwhelm the rendering process. This is especially true on mobile networks or low-powered devices.
This becomes especially noticeable when content-heavy pages try to load all assets at once, significantly slowing down page performance. To address this on a luxury ecommerce platform, we implemented lazy-loading for non-critical elements, which boosted page speed by 5–12%.
-

Typical symptoms that signal inefficiencies:
slow initial load, layout shifts, and increased bounce rates on mobile.
Caching misconfigurations
Caching is supposed to make systems faster, but when the logic behind it doesn’t match how your platform actually behaves, it becomes a blocker.
We’ve seen cases where new promotions didn’t show up for hours because the cache wasn’t cleared properly after publishing. In one case, we fixed the issue by linking cache invalidation directly to content updates, so changes went live without manual work or extra load on the origin.
Catching issues like this early keeps your content and user experience aligned, even under heavy traffic.
-

Typical symptoms that signal inefficiencies:
outdated banners, missing campaign updates, or users in different regions seeing different versions of the site.
Explore common pitfalls and proven patterns to prevent cache-related performance breakdowns. Download our whitepaper: The Hidden Cost of Cache
Integration points
When one part of the system waits on another, especially through external APIs or tightly coupled services, latency builds up fast. What starts as a few seconds of delay in a third-party call can stall entire workflows like checkouts, stock syncs, or content imports.
In one platform we worked on, full promotion imports were regularly taking up to 10 minutes, often failing under load and causing content to go live late. Switching to delta imports and queue-based processing helped bring import times down to seconds.
-

Typical symptoms that signal inefficiencies:
slow-running processes, timeouts, retry loops, and laggy user experience during peak times.
If you want to learn how to design resilient, scalable integrations that don’t compromise performance, download our whitepaper: Integration-Ready Ecommerce
Asynchronous background jobs
Background tasks often handle essential system processes: data imports, syncs, cache refreshes. But because they run independently, it’s not always obvious when something goes wrong.
In one multi-store ecommerce setup, we found that identical data-fetching jobs were running separately across storefronts, overloading the system and causing collisions. We resolved it by consolidating the logic into a centralized handler, cutting down resource use and stabilizing task execution.
-

Typical symptoms that signal inefficiencies:
missed imports, outdated content, silent job failures, and unnecessary load on compute resources.
After understanding where bottlenecks occur, the next step is learning how to detect them early before they impact users or business outcomes.
Preventive Approach: Early Indicators to Monitor
Slow-growing queues, longer database read times, and delayed jobs show signs of trouble before users start reporting issues. The sooner you spot these, the easier they are to fix. Here are the indicators that consistently point to problems early.
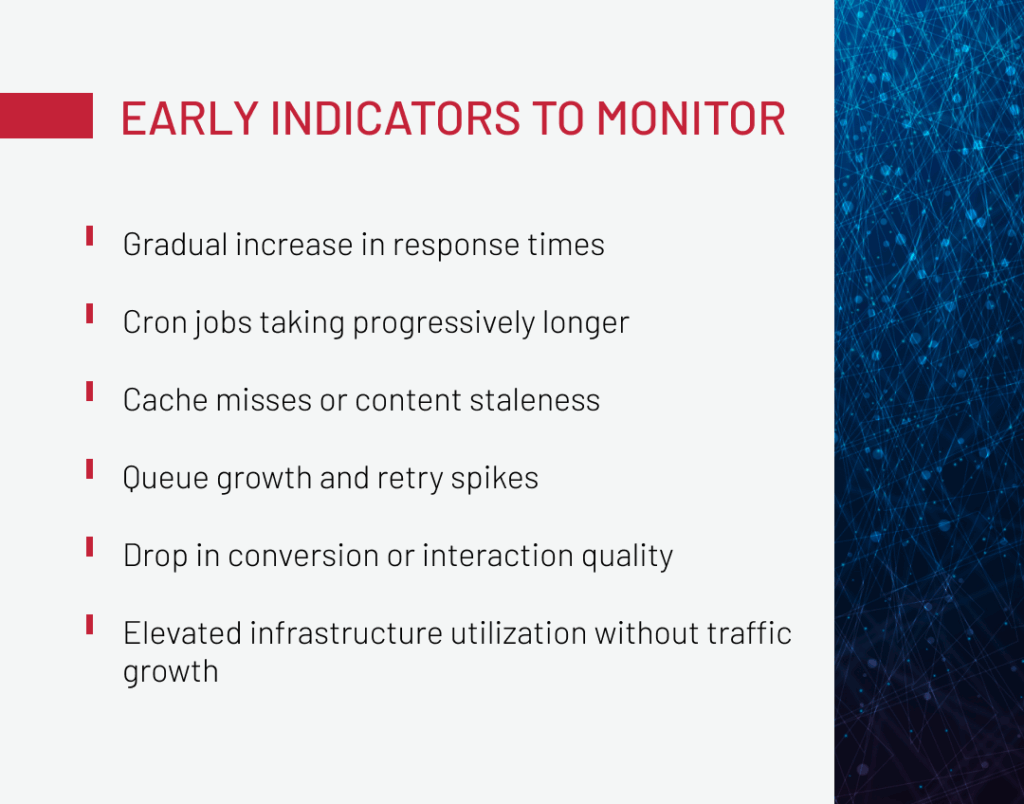
Gradual increase in response times
-

What to keep in mind:
endpoint-level latency drift is an early sign of pressure in your data or caching layers.
In systems with stable traffic, even a subtle increase in response time can indicate inefficient queries or decaying cache performance. We’ve seen this pattern in endpoints tied to cart logic and promotions, where unnecessary DB reads and inconsistent caching led to latency buildup well before any actual incident.
Cron jobs taking progressively longer
-

What to keep in mind:
a growing execution time often means job logic isn’t scaling with data volume or system load, so look for resource contention or duplicated processing.
In one case, a markdown pricing update job started exceeding three hours after a change in request handling logic. We brought execution time back within acceptable limits by switching to a multithreaded processing model. This also revealed a common root cause: background performance issues often trace back to subtle architectural shifts that go unchecked over time.
Cache misses or content staleness
-

What to keep in mind:
a growing number of cache misses or delays in content updates often points to weak spots in your caching layer, usually outdated invalidation rules or loosely coupled triggers.
In one Spartacus-based project, we traced stale promotions and CMS content persisting for hours to incomplete cache invalidation logic specific to that implementation. Delayed campaign launches and inconsistent content began to erode user trust. We resolved it by aligning cache-clearing logic with content triggers, which restored timely updates across all regions.
Queue growth and retry spikes
-

What to keep in mind:
consistent growth in processing queues often reflects downstream instability or blocked integrations.
In a distributed commerce system, we traced unexplained data loss back to missing persistence in the messaging queue. When a node restarted, all queued data was lost. Introducing Redis as persistent storage immediately improved queue reliability and protected against silent failures.
Elevated infrastructure utilization without traffic growth
-
What to keep in mind:
if your CPU or memory usage climbs while user traffic stays flat, internal inefficiencies are likely at play.
We once identified a case where a single request was scanning thousands of configuration properties per call due to missing cache logic. This led to a noticeable spike in memory and CPU usage without any real increase in business load, which is a typical example of technical debt becoming operational risk.
Drop in conversion or interaction quality
-

What to keep in mind:
declining conversion rates or shortened session durations often result from latency, front-end blocking, or data inconsistency.
We observed a consistent pattern across ecommerce sites: degraded Core Web Vitals, especially LCP and CLS, led to higher bounce rates and SEO drops. After optimizing image loading behavior and improving front-end render prioritization, both engagement and rankings recovered.
We help ecommerce teams build systems that stay fast, stable, and scalable under real-world pressure.
Let’s chatBest Practices for a Preventive Performance Approach
In high-load ecommerce systems, performance degradation often begins at the infrastructure or service level. The practices below are drawn from real-world implementations where early detection and architectural foresight were critical to maintaining scalability and stability.
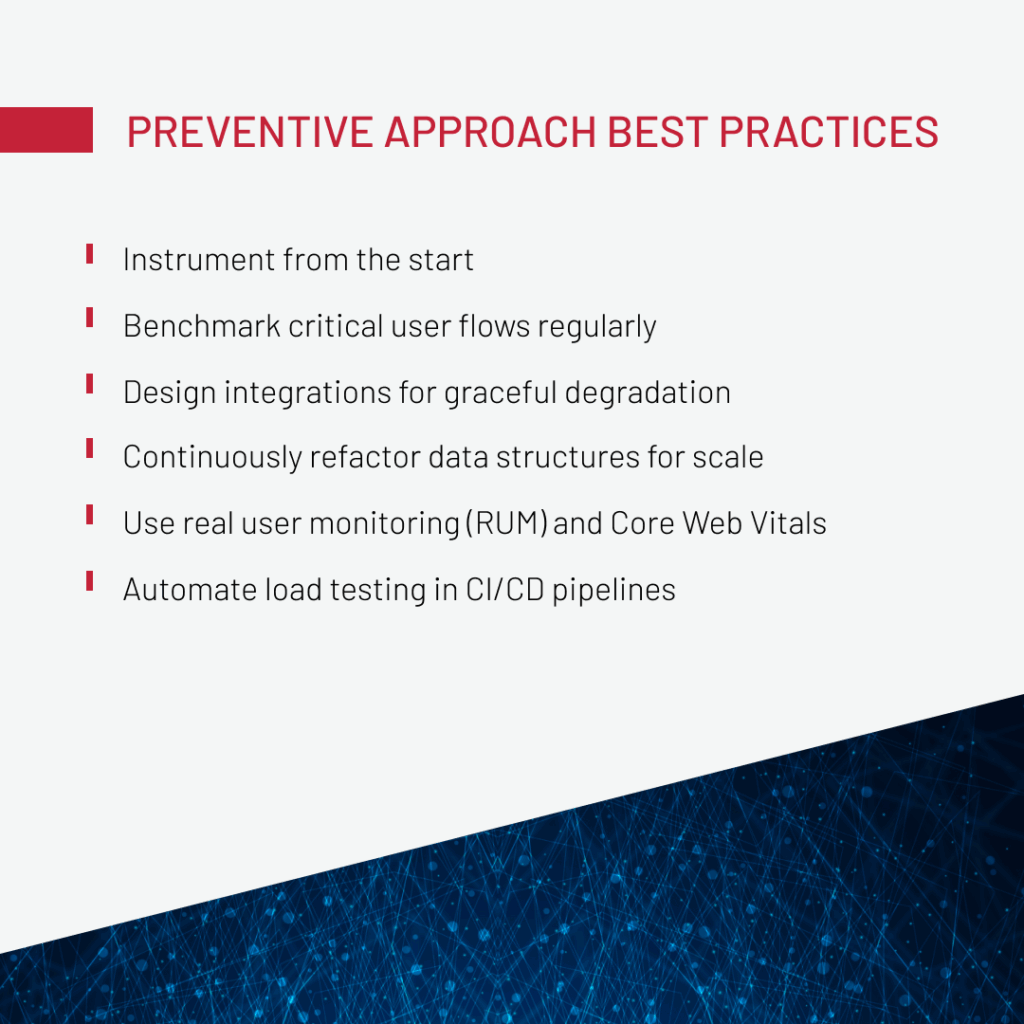
Instrument from the start
Observability should be embedded into the system architecture from the beginning. Method-level instrumentation, including execution times, critical request parameters, and cache metrics, enables teams to track performance drift before it escalates.
In one global commerce platform, this approach allowed our team to spot rising latency in the caching layer early. Since we had logging and tracing set up from the start, we fixed the problem before it affected users or hurt business KPIs.
Benchmark critical user flows regularly
Performance regressions often manifest as gradual slowdowns rather than functional failures. Incorporating regular benchmarking of high-impact flows, such as product detail pages, checkout, and login, helps surface these issues early.
On a high-traffic retail platform, weekly synthetic monitoring exposed a consistent decline in load times on PDPs and cart pages. Functional tests hadn’t caught the degradation, but by comparing benchmark results against defined performance targets, our team was able to address rendering inefficiencies before they affected user behavior.
Design integrations for graceful degradation
During work on a distributed ecommerce system, we identified an issue where promotion imports failed during node restarts. The root cause was an in-memory queuing setup: once the node was down, the queue state was lost, and no retry mechanism was in place to recover the data. Introducing persistent queuing and retry logic fixed the failure. This change made the import process reliable even during heavy use.
This case shows a wider trend. Integrations that don’t have resilience features like timeouts, retries, and state persistence can quickly turn into bottlenecks. As systems grow, integration points that can manage partial failures keep the overall system stable.
Continuously refactor data structures for scale
As usage grows, previously efficient data models can start to introduce latency, particularly in high-traffic workflows like cart retrieval.
In one fast-scaling ecommerce platform, we noticed increasing delays during cart access. During the investigation, we found that the issue came from a relational structure that no longer matched how we read the data. As a result, we switched to a document-based model, which made queries simpler and sped up response time.
Use real user monitoring (RUM) and Core Web Vitals
Relying solely on back-end metrics can overlook serious performance issues, especially on the front-end. Real user monitoring (RUM) and Core Web Vitals (LCP, CLS, FID) provide visibility into how users experience performance across different devices and network conditions, with mobile often being the most affected.
Integrating RUM and Core Web Vitals into your performance monitoring stack helps ensure that user-facing issues are not hidden by clean back-end indicators.
Define SLOs based on what users actually experience
Performance metrics only become actionable when they’re tied to expectations. By converting front-end metrics (e.g., LCP < 2.5s, CLS < 0.1) and API latencies into Service Level Indicators (SLIs), you can define meaningful Service Level Objectives (SLOs) that reflect the user’s perception of quality.
This creates a shared performance language between product, engineering, and operations. Instead of chasing arbitrary metrics, teams can prioritize based on impact and risk, and trigger alerts not just when something is broken, but when it’s trending toward failure.
Automate load testing in CI/CD pipelines
On a high-growth commerce platform, we helped the team integrate load testing into their CI/CD pipeline. Before every release, they simulated high-traffic scenarios across checkout and catalog flows. This made it possible to detect performance regressions early and avoid slowdowns in production under real-world load.
This example shows a broader best practice: manual performance testing does not keep up with fast delivery cycles. Adding automated load and stress testing into the CI/CD process with tools like k6, JMeter, or Artillery helps check system behavior under pressure and maintains consistent release quality.
Tools to Enable Preventive Monitoring
All these best practices still need the right tools to work well. The following categories and platforms create a solid stack for finding, examining, and fixing performance bottlenecks before they affect end users.
| Category | Tools | Use Cases |
| Application Performance Monitoring (APM) | New Relic, Dynatrace, Datadog | Visualize slow transaction traces, detect memory leaks, or pinpoint high-latency endpoints in microservices. |
| Front-end Performance and Experience Monitoring | Lighthouse, PageSpeed Insights, WebPageTest, Chrome UX Report, RUM | Identify layout shifts, slow-loading content, or regressions in visual rendering using Core Web Vitals and real-user experience data |
| Infrastructure and System Monitoring | Grafana + Prometheus, ELK Stack (Elasticsearch, Logstash, Kibana), Zabbix, Netdata | Detect resource saturation, excessive garbage collection, or pod/container instability in environments like Kubernetes. |
| Caching and Queue Observability | Redis CLI, RedisInsight, Kafka Manager, Confluent Control Center | Monitor cache hit/miss ratios, memory usage, consumer lag, topic throughput, and broker health. Set alerts to prevent stale data or dropped messages. |
| Static Code and Configuration Quality Scanning | SonarQube, SonarCloud, Checkov, Snyk, Veracode | Block performance regressions caused by anti-patterns like N+1 queries, nested loops, or insecure configuration before deployment. |
| Load and Stress Testing | k6, Apache JMeter, Artillery, Gatling | Test checkout flows, imports, and background jobs under simulated peak load (e.g., Black Friday traffic) to validate system behavior and scalability. |
Final Thoughts
Performance issues in ecommerce platforms often follow clear patterns, such as inefficient database queries, misconfigured cache layers, slow integrations, or overloaded background jobs. If these problems are not fixed, they lead to slower releases, higher infrastructure costs, and lost revenue.
Organizations that treat performance as an afterthought get stuck in a cycle of reacting to problems. They investigate, fix, apologize, and repeat. In contrast, teams that watch for early signs can act before issues impact production. This shift to a preventive approach leads to faster delivery, more reliable operations, and a better experience for users.
If you have questions about preventive performance strategies or the patterns mentioned here, we’re ready for a technical conversation. Feel free to reach out.
FAQ
-

What is a performance bottleneck?
A performance bottleneck is a specific point in the system. It could be a database query, an API call, a caching layer, or a background job. It limits how much data can move through the system, raises latency, or prevents the system from scaling well when it’s under load.
-

What is a bottleneck example?
A typical example is a database join across large tables without proper indexing. As data grows, these queries become more expensive. This can lead to slow page loads, timeouts, and, ultimately, poor performance in important user flows like search or checkout.
-
How do you identify a performance bottleneck?
In our experience, bottlenecks come from slow endpoints, long queues, and delayed jobs. We spot them early by using logs, method-level metrics, and RUM data, especially when back-end metrics do not clarify front-end slowdowns.
With over 15 years of experience in ecommerce architecture, Andreas Kozachenko, Head of Technology Strategy and Solutions at Expert Soft, provides strategic guidance to help teams prevent performance bottlenecks in high-load enterprise systems.
New articles

See more

See more

See more

See more

See more
